Assessing quantification performance
After reads have been simulated for a set of input transcripts, and quantification tools have been executed to estimate transcript abundance, the final stage of the piquant pipeline is to calculate statistics and draw graphs to aid the assessment of transcript quantification performance and resource usage. Note that performance is assessed both at the level of individual quantification runs (i.e. a particular transcript quantification tool executed once for reads simulated according to a certain set of sequencing parameters), and also across multiple quantification runs for comparison of performance. The data and plots generated in each case are detailed below (see Assessment of a single quantification run and Assessment of multiple quantification runs); however, we first describe the statistics calculated, and the classifiers used to split transcripts into groups sharing similar properties.
Statistics
For each execution of a particular transcript quantification tool for reads simulated according to a certain set of sequencing parameters, a number of statistics are calculated from the real and estimated transcript abundances. Those calculated by default are listed below; however it is easy to extend piquant to calculate additional statistics (see Adding a new statistic).
Note that each statistic is calculated both for the set of estimated transcript abundances as a whole, and for each group of transcripts determined to share similar properties by each transcript classifier (see Transcript classifiers).
Note also that each statistic can be marked as being suitable for producing interesting graphs or not; all statistics described below are suitable for graphing unless stated otherwise.
Number of ‘expressed’ transcripts
This is simply the number of transcripts in the RNA-seq data set with non-zero “ground truth” TPM. Note, however, that all real and estimated TPM values below the threshold defined by the command line option --not-present-cutoff are truncated to zero, before this or any other statistics are calculated. Estimating the abundance of very rare transcripts is difficult, and truncation is performed to avoid biasing analyses with differences between very low real and estimated TPM values that are likely of little biological interest.
This statistic is marked as being not suitable for producing graphs.
Spearman correlation
The Spearman rank correlation coefficient between real and estimated TPMs for transcripts considered to be expressed after truncation of TPM values below the low abundance threshold. When assessing quantification performance, a higher correlation coefficient is considered to be better.
Error fraction
The fraction of expressed transcripts for which the estimated TPM is greater than a certain threshold percentage higher or lower than the real TPM; when assessing quantification performance, a lower error fraction is considered to be better. The threshold percentage is defined by the command line option --error-fraction-threshold, which must be specified when executing the piquant command prepare_quant_dirs. The default value is set at 10%.
Median percent error
For expressed transcripts, the median value of the percentage errors of estimated compared to real TPMs; when assessing quantification performance, a median percent error closer to zero is considered to be better. This statistic can also indicate whether a particular quantification tool tends to over- or under-estimate transcript abundances, for transcripts as a whole, or for certain classes of transcript.
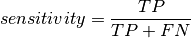
Sensitivity
The sensitivity (or true positive rate) of a transcript quantification method is calculated to be the fraction of expressed transcripts (that is, both “true positives” and “false negatives”) which were correctly identified by the quantification tool as being present (just the “true positives”):
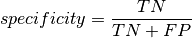
Specificity
The specificity (or true negative rate) of a transcript quantification method is calculated to be the fraction of transcripts considered to be not expressed (that is, their real TPM value lies below the truncation threshold - both “true negatives” and “false positives”), which were correctly identified as not being present (just the “true negatives”):
Transcript classifiers
Transcript classifiers split the whole set of input transcripts into discrete groups, these groups sharing some similar property; such a division of transcripts then allows the performance of quantification tools to be assessed across different types of transcripts. The transcript classifiers provided by default are listed below; however it is easy to extend piquant to add additional classifiers (see Adding a new transcript classifier).
Note, however, that transcript classifiers fall into one of two distinct types, and these types are described first.
“Grouped” classifiers
The first type of transcript classifiers generally split the set of input transcripts into fixed groups dependent on some property inherent in the transcripts (or their simulated abundances) themselves. For example, one could consider “short”, “medium” or “long” transcripts, or those expressed at “low”, “medium” or “high” simulated abundance.
The following “grouped” classifiers are provided:
“Distribution” classifiers
The second type of transcript classifiers split the set of input transcripts into two groups, those above and below some threshold, where that threshold is generally the value of some property of quantification. For example, one could consider transcripts whose estimated abundance is more or less than a certain percentage different from the real abundance. By varying the threshold value, these classifiers can be used to produce graphs of the distribution of the property in question.
The following “distribution” classifier is provided:
Number of transcripts of originating gene
This classifier simply groups transcripts according to the number of isoforms of their originating gene.
Real transcript abundance
This classifier groups transcripts by a measure of their real abundance. Five categories of prevalence are defined according to the log (base 10) of their real abundance in transcripts per million:
- Log real TPM <= 0 (<=1 transcript per million)
- Log real TPM <= 0.5 (>1 and <=3.16 transcripts per million)
- Log real TPM <= 1: (>3.16 and <=10 transcripts per million)
- Log real TPM <= 1.5: (>10 and <=31.6 transcripts per million)
- Log real TPM > 1.5: (>31.6 transcripts per million)
Transcript length
This classifier groups transcripts by their length in bases. Four categories are defined:
- very short: length <= 500 bases
- short: > 500 and <= 1000 bases
- medium: > 1000 and <= 3000 bases
- long: > 3000 bases
Transcript unique sequence percentage
This classifier groups transcripts by the percentage of their sequence which they do not share with any other transcript within their gene of origin. Five categories of transcripts are defined:
- > 0 and <=20% unique sequence
- > 20 and <=40% unique sequence
- > 40 and <=60% unique sequence
- > 60 and <=80% unique sequence
- > 80 and <=100% unique sequence
Transcript unique sequence length
This classifier groups transcripts by the absolute length of sequence which they do not share with any other transcript within their gene of origin. Five categories are defined according to the length of unique sequence:
- 0 unique bases
- > 0 and <= 100 unique bases
- > 100 and <= 300 unique bases
- > 300 and <= 1000 unique bases
- > 1000 unique bases
Absolute percent error
This “distribution” classifier splits transcripts into two groups according to whether the absolute percentage difference between each transcripts estimated and real abundances is greater or less than a given amount.
Resource usage statistics
For each execution of a particular transcript quantification tool for reads simulated according to a certain set of sequencing parameters (and also for the single execution of the prequantification steps for each quantification tool), the following resource usage statistics are recorded:
- Real time: The total elapsed real time of all quantification (or prequantification) commands in seconds, log base 10 (via the
%eformat option of the GNUtimecommand) - User time: The total number of CPU-seconds (log base 10) that all quantification (or prequantification) commands spent in user mode (via the
%Uformat option of GNUtime). - System time: The total number of CPU-seconds (log base 10) that all quantification (or prequantification) commands spent in kernel mode (via the
%Sformat option of GNUtime). - Maximum memory: The maximum resident memory size of any quantification (or prequantification) command during its execution, in gigabytes (via the
%Mformat option of GNUtime).
Assessment of a single quantification run
Statistics and plots for a single execution of a quantification tool are produced by the support script analyse_quantification_run (see Perform accuracy analysis) that is run by invoking run_quantification with the -a command line option (see Quantifying expression). The following CSV files and plots (written as PDF files by default) are produced:
CSV files
<run-id>_transcript_stats.csv: A CSV file containing a single row, with a field for each defined statistic (see Statistics above) which has been calculated over the whole set of input transcripts. CSV fields are also present describing the quantification tool and sequencing parameters used (i.e. read length, sequencing depth etc.).<run-id>_gene_stats.csv: A corresponding CSV file, also containing a single row, with a field for each defined statistic which has been calculated over the whole set of input genes. Both real and estimated gene “TPMs” are calculated by summing the respective TPM values for that gene’s transcripts. As above, CSV fields are also present describing the quantification tool and sequencing parameters used.<run-id>_transcript_stats_by_<classifier>.csv: A CSV file is created for each “grouped” transcript classifier (see “Grouped” classifiers). Each CSV file contains the same fields as<run-id>_transcript_stats.csv; however, statistics are now calculated for distinct subsets of transcripts as determined by the transcript classifier, and the CSV file contains one row for each such group. For example, the CSV file<run-id>_by_gene_trancript_number.csvcontains statistics calculated over those transcripts whose originating gene has only one isoform, those for which the gene has two isoforms, and so on.<run-id>_transcript_distribution_stats_<asc|desc>_by_<classifier>.csv: Two CSV files (“ascending” and “descending”) are created for each “distribution” transcript classifier (see “Distribution” classifiers). For a range of values of the classifier’s threshold variable (such range being appropriate to the classifier), the “ascending” file contains a row for each threshold value, indicating the fraction of expressed transcripts lying below the threshold. Similarly, for the same range of values, the “descending” file indicates the fraction of transcripts lying above the threshold.<run-id>_quant_usage.csv: A CSV file containing a single row, with a field for each resource usage statistic (see Resource usage statistics above) calculated over the commands used during quantification. CSV fields are also present describing the quantification tool and sequencing parameters used.<run-id>_prequant_usage.csv: A corresponding CSV file containing resource usage statistics calculated over the commands used during prequantification. Note that this file will only exist if prequantification commands (which are executed only once per quantifier) happened to be run in this directory.
Note that neither of the resource usage CSV files will exist if the piquant command prepare_quant_dirs was run with the --nousage option.
Plots
<run-id>_transcript_TPMs_log10_scatter.pdf: A scatter plot of log-transformed (base 10) estimated against real transcript abundances measured in transcripts per million, for transcripts with non-zero real and estimated abundances.<run-id>_gene__TPMs_log10_scatter.pdf: A scatter plot of log-transformed (base 10) estimated against real gene abundances measured in transcripts per million, for genes with non-zero real and estimated abundances.<run-id>_<statistic>_by_<classifier>.pdf: For each “grouped” transcript classifier, and each statistic marked as being suitable for producing graphs (see Statistics above), a plot is created showing the value of that statistic for each group of transcripts determined by the classifier.<run-id>_<classifier>_expressed_TPMs_boxplot.pdf: A boxplot is created for each “grouped” transcript classifier showing, for each group of transcripts determined by the classifier, the characteristics of the distribution of log (base 10) ratios of estimated to real transcript abundances for transcripts within that group with non-zero real and estimated abundances.<run-id>_<classifier>_expressed_TPMs_<asc|desc>_distribution.pdf: Two plots are drawn for each “distribution” transcript classifier. These correspond to the data in the CSV files described above for these classifiers, and show, for expressed transcripts, the cumulative distribution of the fraction of transcripts lying below or above the threshold determined by the classifier.
Assessment of multiple quantification runs
Statistics and plots comparing multiple quantification runs are produced by executing the piquant command analyse_runs (see Analyse quantification results). Note that depending on the number of combination of quantification and read simulation parameters that analyse_runs is executed for, a very large number of graphs may be produced; it may, therefore, be useful to concentrate attention on those parameter values which are of greatest interest.
The following CSV files and plots (written as PDF files by default) are produced:
CSV files
overall_transcript_stats.csv: A CSV file with a field for each defined statistic which has been calculated over the whole set of input transcripts for each quantification run. This data is concatenated from the individual per-quantification run<run-id>_transcript_stats.csvfiles described above.overall_gene_stats.csv: A corresponding CSV file with a field for each defined statistic which has been calculated over the whole set of input genes for each quantification run. This data is concatenated from the individual per-quantification run<run-id>_gene_stats.csvfiles described above.overall_transcript_stats_by_<classifier>.csv: A CSV file for each “grouped” transcript classifier, containing the same fields asoverall_transcript_stats.csv, with statistics calculated for distinct subsets of transcripts as determined by the classifier, for each quantification run. This data is concatenated from the individual per-quantification run<run-id>_transcript_stats_by_<classifier>.csvfiles described above.overall_transcript_distribution_stats_<asc|desc>_by_<classifier>.csv: Two CSV files (“ascending” and “descending”) for each “distribution” transcript classifier, indicating the fraction of transcripts lying above or below values of the classifier threshold variable, for each quantification run. This data is concatenated from the individual per-quantification run<run-id>_transcript_distribution_stats_<asc|desc>_by_<classifier>.csvfiles.overall_quant_usage.csv: A CSV file with a field for each resource usage statistic which has been calculated for each quantification run. This data is concatenated from the individual per-quantification run<run-id>_quant_usage.csvfiles described above.overall_prequant_usage.csv: A CSV file with a field for each resource usage statistic which has been calculated when prequantification steps were run for each quantifier. This data is concatenated from the individual per-quantifier<run-id>_prequant_usage.csvfiles described above.
Note that neither of the resource usage CSV files will exist if the piquant command analyse_runs was run with the --nousage option.
Plots
Plots produced by the analyse_runs commands fall into four categories:
“Overall statistics” graphs
In the sub-directory overall_transcript_stats_graphs, a sub-directory per_<parameter_1> is created for each quantification and simulation parameter for which quantification runs were performed for more than one value of that parameter (for example, for read lengths of 35, 50 and 100 base pairs, or for single- and paired-end reads). A boxplot is produced in this directory for each graphable statistic, showing the distribution of values of that statistic over all quantification runs which share each different value of parameter 1:
overall_<statistic>_per_<parameter_1>.pdf
Also within each per_<parameter_1> directory, a further by_<parameter_2> directory is created for each quantification and simulation parameter for which quantification runs were performed for more than one value of that second parameter (excluding parameter 1 itself). Within each by_<parameter_2> directory, a <statistic> directory is created for each statistic marked as capable of producing graphs.
Within each statistic directory, a boxplot is produced showing the distribution of values of that statistic over all quantification runs which share each different value of parameter 1, but further grouped into those quantification runs which share each different value of parameter 2:
overall_<statistic>_per_<parameter_2>_per_<parameter_1>.pdf
Furthermore, in the case that parameter 2 takes numerical values (for example, read length or read depth) graphs are written which plot statistics on the y-axis against values of parameter 2 on the x-axis; a separate coloured line is shown on these graphs for each value of parameter 1. A plot will be produced for every combination of values of quantification and read simulation parameters, excluding parameter 1 and parameter 2:
overall_<statistic>_vs_<numerical_parameter_2>_per_<parameter_1>_<other_parameter_values>.pdf
So, for example, the directory overall_transcript_stats_graphs/quant_method will contain a boxplot for each graphable statistic, showing the distribution of values of that statistic over all quantification runs sharing the same quantification method. Then, each statistic’s directory below, say, overall_transcript_stats_graphs/quant_method/by_read_depth/ will contain, firstly, a boxplot of the distribution of values of that statistic over all quantification runs which share the same quantification method, further grouped into those runs which share the same read depth. Secondly, the directory will contain a plot of that statistic on the y-axis, against read depth on the x-axis, with a line for each quantification method, for each combination of read length, single- or paired-end reads, etc. as specified by the analyse_runs command that was executed.
The sub-directory overall_gene_stats_graphs is structured in the same way as the overall_transcript_stats_graphs directory, but contains graphs of statistics plotted at the level of gene, rather than transcript, TPMs.
“Grouped statistics” graphs
In the sub-directory grouped_stats_graphs, a sub-directory grouped_by_<classifier> is created for each “grouped” transcript classifier. Graphs written below this directory will plot statistics calculated for groups of transcripts determined by that classifier. Firstly, a boxplot is produced for each graphable statistic, showing the distribution of values of that statistic for each group of transcripts determined by the classifier over all quantification runs:
grouped_<statistic>_per_<classifier>.pdf
Also within each grouped_by_<classifier> directory, a sub-directory per_<parameter> is created for each quantification and simulation parameter for which quantification runs were performed for more than one value of that parameter. Within each per_<parameter> directory, a <statistic> directory is created for each statistic marked as capable of producing graphs.
Within each statistic directory, a boxplot is produced showing the distribution of values of that statistic for each group of transcripts determined by the classifier over all quantification runs, but further grouped into those runs which share each different value of parameter:
grouped_<statistic>_per_<parameter>_per_<classifier>.pdf
In addition, a complementary boxplot shows the distribution of values of the statistic grouped into those runs which share each different value of parameter, and then secondarily grouped according to the transcript classifier:
grouped_<statistic>_per_<classifier>_per_<parameter>.pdf
Furthermore, a set of graphs are written which plot statistics with a separate, coloured line for each value of parameter:
grouped_<statistic>_vs_<classifier>_per_<parameter>_<other_parameter_values>.pdf
A plot will be produced for every combination of values of quantification and read simulation parameters, excluding the “per” parameter described above. For example, the sensitivity directory below grouped_stats_graphs/grouped_by_transcript_length/per_read_length will contain a plot of sensitivity on the y-axis, against transcript length on the x-axis, with a line for each simulated read length, for each combination of quantification method, read depth, etc. as specified by the analyse_runs command that was executed.
“Distribution statistics” graphs
In the sub-directory distribution_stats_graphs, a sub-directory <classifier>_distribution is created for each “distribution” transcript classifier. Graphs written below this directory will plot the cumulative distribution of the fraction of transcript lying below or above values of the threshold determined by the classifier.
Within each <classifier>_distribution directory, a sub-directory per_<parameter> is created for each quantification and simulation parameter for which quantification runs were performed for more than one value of that parameter. Graphs written into this directory will plot statistics with a separate, coloured line for each value of that parameter, and will be named:
distribution_<classifier>_per_<parameter>_<asc|desc>_<other_parameter_values>.pdf
As before, a plot will be produced for every combination of values of quantification and read simulation parameters, excluding the “per” parameter.
“Resource usage statistic” graphs
In the sub-directory resource_usage_graphs, a directory structure is created in exactly the same way as for “Overall statistics” graphs (see above). However, in this case, the graphs plotted measure resource usage statistics rather the than accuracy statistics calculated over sets of transcripts or genes.
The resource_usage_graphs directory also contains, at the top level, two graphs pertaining to prequantification: prequant_time_usage.pdf is a bar plot comparing the real, user and kernel mode time taken by prequantification for each quantification method, and prequant_memory_usage.pdf is a bar plot comparing the maximum resident memory occupied by any process during prequantification.